AOP Tracker

Plans versus actuals, visible every day instead of at year end.

Deployed, multiple clientsRunning for manufacturing, interiors, and professional-services businesses.

Operating-plan tracking

AOP Tracker

Real screens from the running product, shown against a demo dataset. No client data.

/dashboard
AOP Tracker dashboard: annual plan versus achievement for a jewellery business with seven branches, showing year-to-date achievement, annual target, quarterly progress, and the monthly trend chart.

Dashboard — annual plan versus achievement across all seven branches

01 / A closer look

The figures it turns on

Operating-plan tracking

AOP Tracker

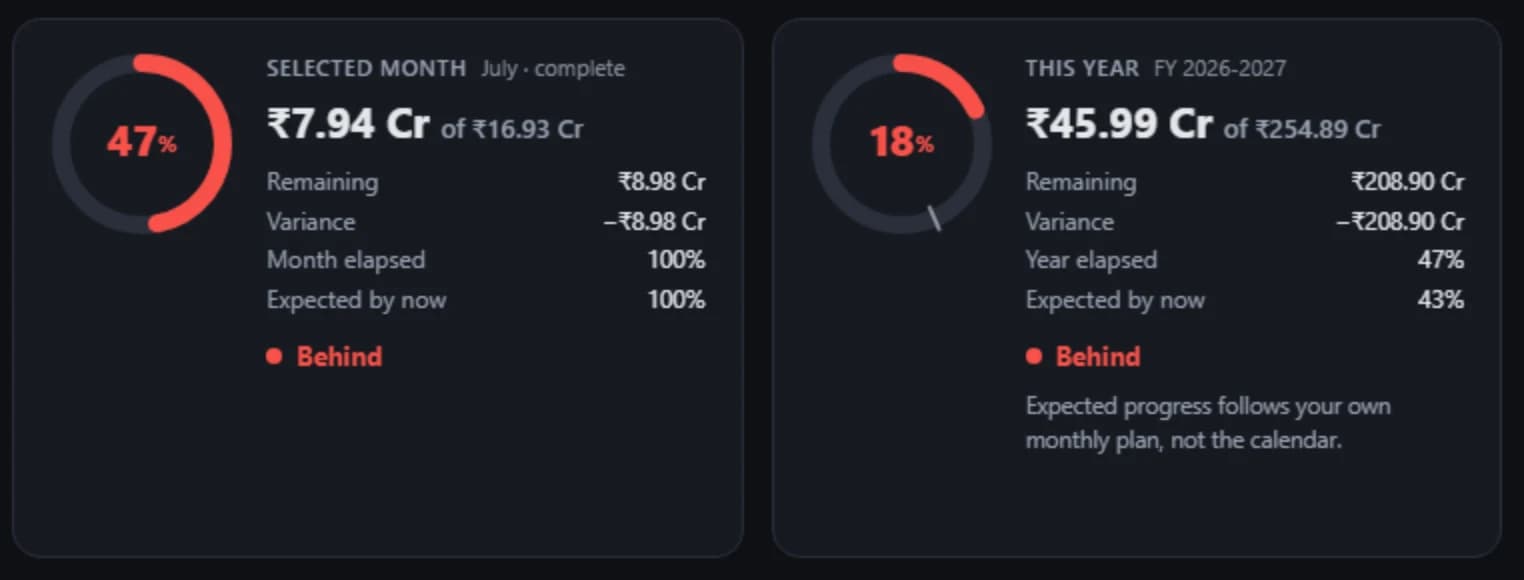
AOP Tracker dashboard cards: the selected month at 47% of plan with remaining, variance and elapsed figures, and the full year at 18% of a Rs 254.89 crore annual plan, each marked Behind.
Plan against achievement, month and year/dashboard
AOP Tracker gross profit strip: actual sales Rs 45.99 crore, gross profit Rs 2.78 crore at 6.1% of sales, making charges Rs 2.52 crore, expenses Rs 84.05 lakh, net profit Rs 1.94 crore at 4.2% margin.
Gross profit, derived from recorded actuals/profit
AOP Tracker branch list: four of seven branches with month and year progress bars, each between 15% and 54% of plan and flagged Behind.
Every branch against its own plan/dashboard

Regions from the running product against a demo dataset. No client, no real figures — and nothing from KIT's own operator console.

02 Capability

What it does today

Shipped and running — not a roadmap.

Plan vs actual, daily

The plan stops being a January document and becomes a daily view.

Per-business deployments

Each client runs their own instance with their own structure.

Managed by KIT

Deployed, monitored, and operated as a service.

Tell us what your business is fighting.

One conversation. We will tell you honestly what to build, what to buy, and what to skip.